
Trusted by valuation and advisory teams






Public Companies
11,000+
Transactions
140,000+
Closed End Funds
500+
Industry Reports
1,200+
Comp Set · Distribution & Industrial Services
| Company | EV | Revenue | EBITDA | EV/EBITDA ↓ | 3-Yr CAGR |
|---|---|---|---|---|---|
| Fastenal · FAST | $45.8B | $7.5B | $1.7B | 26.9x | +7.4% |
| Watsco · WSO | $18.4B | $7.4B | $800M | 23.0x | +6.1% |
| Transcat · TRNS | $830M | $270M | $39M | 21.3x | +14.0% |
| W.W. Grainger · GWW | $54.1B | $17.2B | $3.1B | 17.4x | +8.2% |
| SiteOne Landscape · SITE | $7.3B | $4.5B | $430M | 17.0x | +8.9% |
| Applied Industrial · AIT | $9.6B | $4.5B | $600M | 16.0x | +9.1% |
| Core & Main · CNM | $12.1B | $7.4B | $920M | 13.2x | +10.8% |
| Hillman Solutions · HLMN | $2.9B | $1.5B | $230M | 12.6x | +4.2% |
| MSC Industrial · MSM | $5.4B | $3.8B | $480M | 11.2x | −1.4% |
| DXP Enterprises · DXPE | $1.3B | $1.8B | $133M | 9.8x | +12.6% |
| Median | $8.5B | $4.5B | $540M | 16.5x | +8.6% |
Click any row to load it into the formula bar. Sourced from 10-K and 10-Q filings.
Search
Screen the universe down to the perfect comps.
Sector, size, multiple and growth — set the criteria and the comp set rebuilds as you go. Save the screen and it re-runs on the next data refresh.
Target PDF
Your Layout
Spread
Private company financials spread directly into your models.
AI maps every line into the layout your firm already uses — 93% matched on the first pass, exceptions flagged rather than quietly absorbed. Spreading five years by hand typically takes 4–6 hours; Spread maps them in about five minutes.
Excel
Power your valuation models with live data.
One function pulls a line item, a multiple or a whole comp set into your workbook, and refreshes it when the filing updates.
- Run comps as of a specific valuation date with point-in-time data
- Pull closed-end fund data into the same model
- Add historical betas and volatilities to any comp set
- With TagniFi Spread, pull private company financials and tax returns straight into your Excel models
No exports, no stale tabs.
NAICS 333 · Machinery Manufacturing
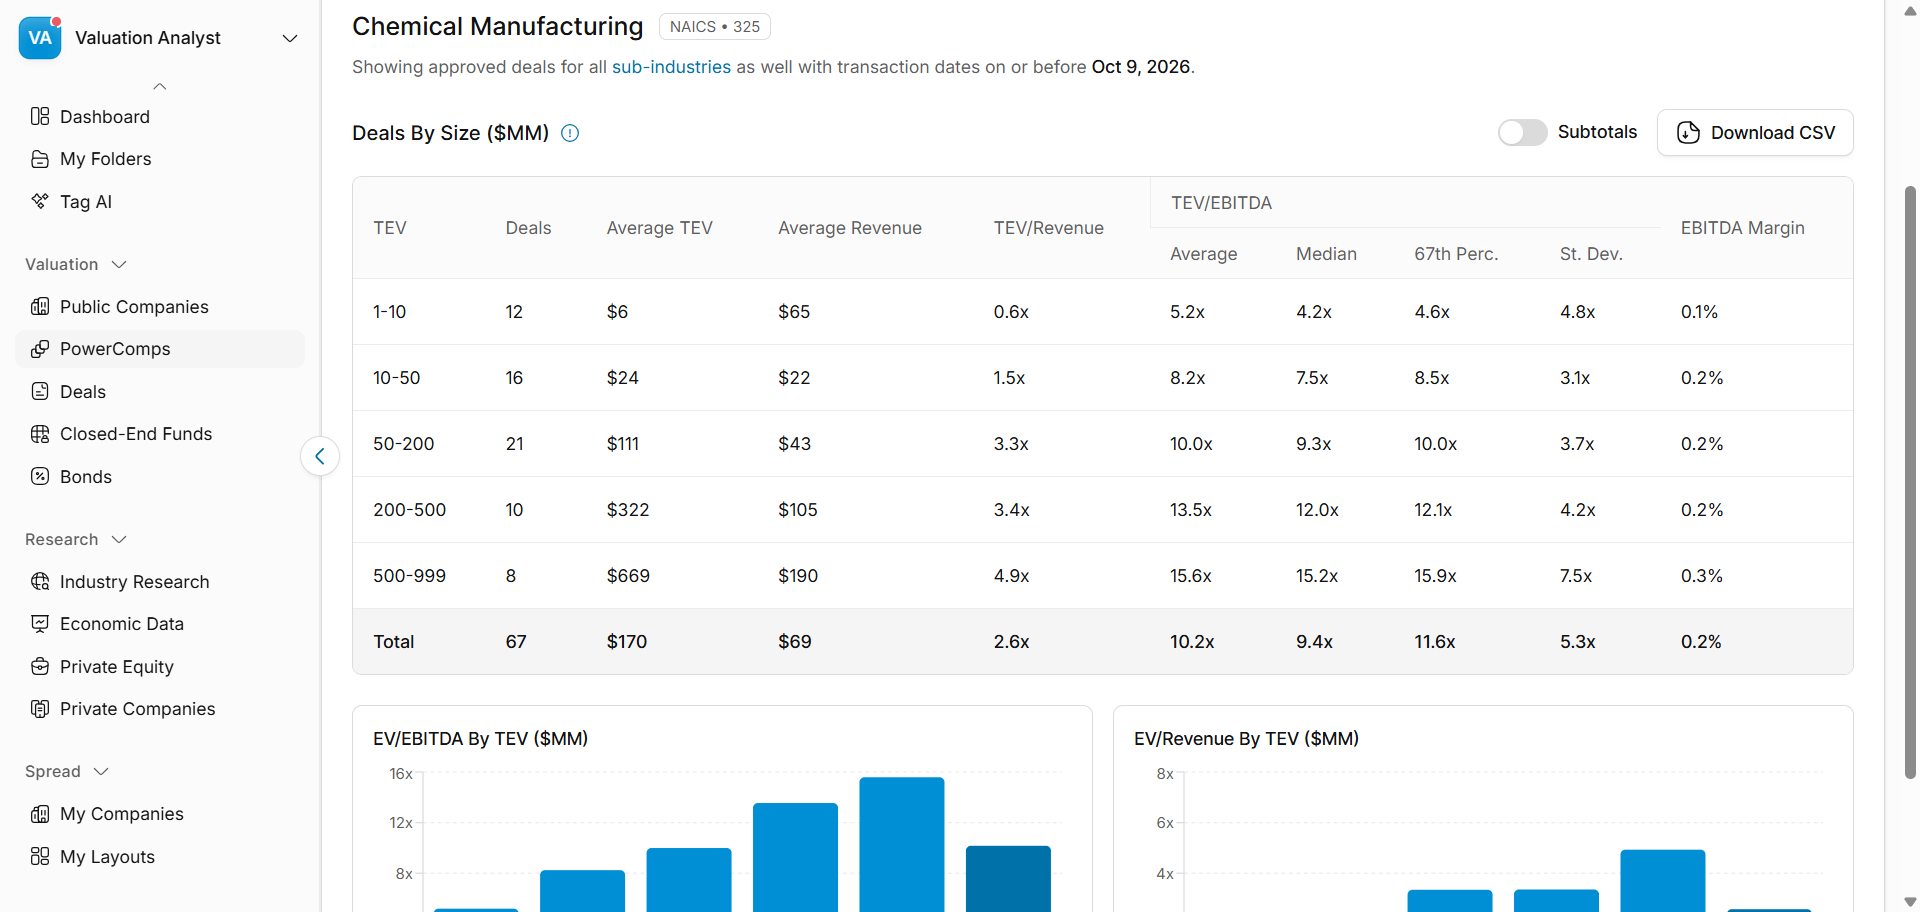
348 approved deals · TEV bands in $ millions
Research
Industry research and economic updates you can cite in your reports
Point-in-time research to satisfy Revenue Ruling 59-60 requirements. Everything is cited and fully referenced.
Q3-2026 Quarterly Economic Update
Strong growth, hotter inflation, and a Fed that changed direction
Guideline Public Companies: Good Comps vs. Perfect Comps
"In reality, the most credible valuations are built not on perfection, but on disciplined imperfection—where good comps, thoughtfully selected and rigorously…
New Industry Report: Cosmetics and Beauty Supply Stores
"In the U.S., the industry is projected to hit $39 billion, growing steadily at a 3–4% CAGR, led by the premium and specialty beauty segments."